PowerBI Introduction
Power BI is a business analytics and data visualization tool developed by Microsoft. It allows users to connect to various data sources, including Excel spreadsheets, databases, and cloud-based platforms such as Azure and Google Analytics, to create interactive reports and dashboards.
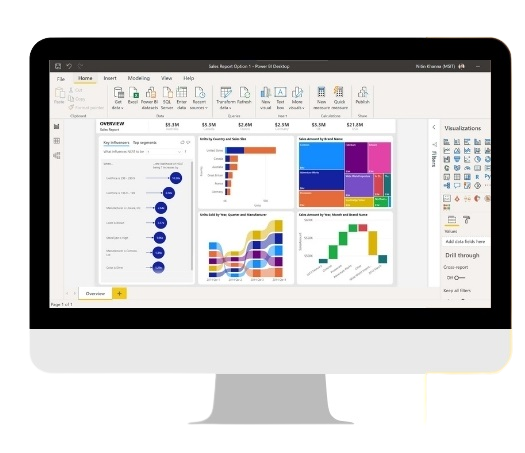
Power BI provides a wide range of visualization options, such as charts, tables, and maps, to help users present data in a clear and insightful manner. It also includes features such as natural language processing (NLP) and artificial intelligence (AI) to enable users to ask questions in plain language and receive answers in the form of visualizations.
Power BI can be used by business analysts, data scientists, and other professionals to gain insights into their organization's data and make informed decisions. It is also used by businesses of all sizes and across industries to monitor performance, track key metrics, and identify trends.
Power BI offers both a desktop application for creating and editing reports and a web-based service for sharing and collaborating on reports with others. Additionally, Power BI can be integrated with other Microsoft tools such as Excel and SharePoint, as well as third-party applications, to provide a more comprehensive analytics solution.