Redux Devtools
Redux-Devtools provide us debugging platform for Redux apps.
It allows us to perform time-travel debugging and live editing.
Some of the features in official documentation are as follows:
It lets you inspect every state and action payload.
It lets you go back in time by “cancelling” actions.
If you change the reducer code, each “staged” action will be re-evaluated.
If the reducers throw, we can identify the error and also during which action this happened.
With persistState() store enhancer, you can persist debug sessions across page reloads.
There are two variants of Redux dev-tools as given below −
Redux DevTools − It can be installed as a package and integrated into your application as given below:
https://github.com/reduxjs/redux-devtools/blob/master/docs/Walkthrough.md#manual-integration
Redux DevTools Extension − A browser extension that implements the same developer tools for Redux is as follow:
https://github.com/zalmoxisus/redux-devtools-extension
How do I use Redux DevTools?
Install Redux browser dev-tools (Chrome and Firefox)
Install dev-tools npm package and import it into store file.
Open developer tools with app running and click on the Redux option.
Console tools show running actions and state.
It provides time traveling, detail charting, and customization to actions/state.
What is the Redux DevTools Extension?
It is basically a console which you can set up in your development environment (Google Chrome)
to visualize actions and state changes that take place in a redux application. We will set up the
Redux DevTools step by step for a simple project.
Now we will set up Redux DevTools extension step by step
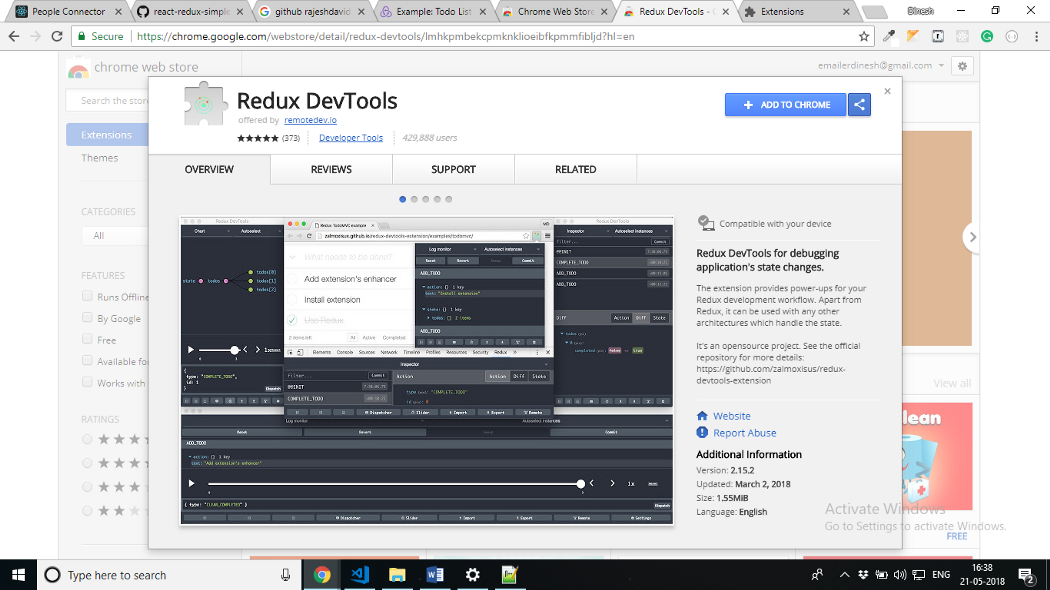
Adding Redux DevTools extension to our browser (Google Chrome)
Installing Dependencies for Redux DevTools & Adding Redux DevTools to your store.
Visualizing your states and actions in Redux DevTools Console.
Adding Redux DevTools extension to our browser (Google Chrome)
Download and install Redux DevTools extension to your chrome browser as shown below.
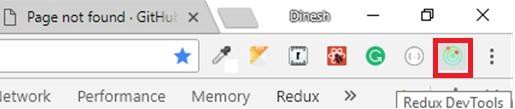
After adding the extension you can see an icon in the top right corner of your browser as shown below:
2.Installing Dependencies for Redux DevTools
We will install the Redux DevTools extension to our dev dependencies using the commands shown below.
Commands :
npm install — save-dev redux-devtools-extension
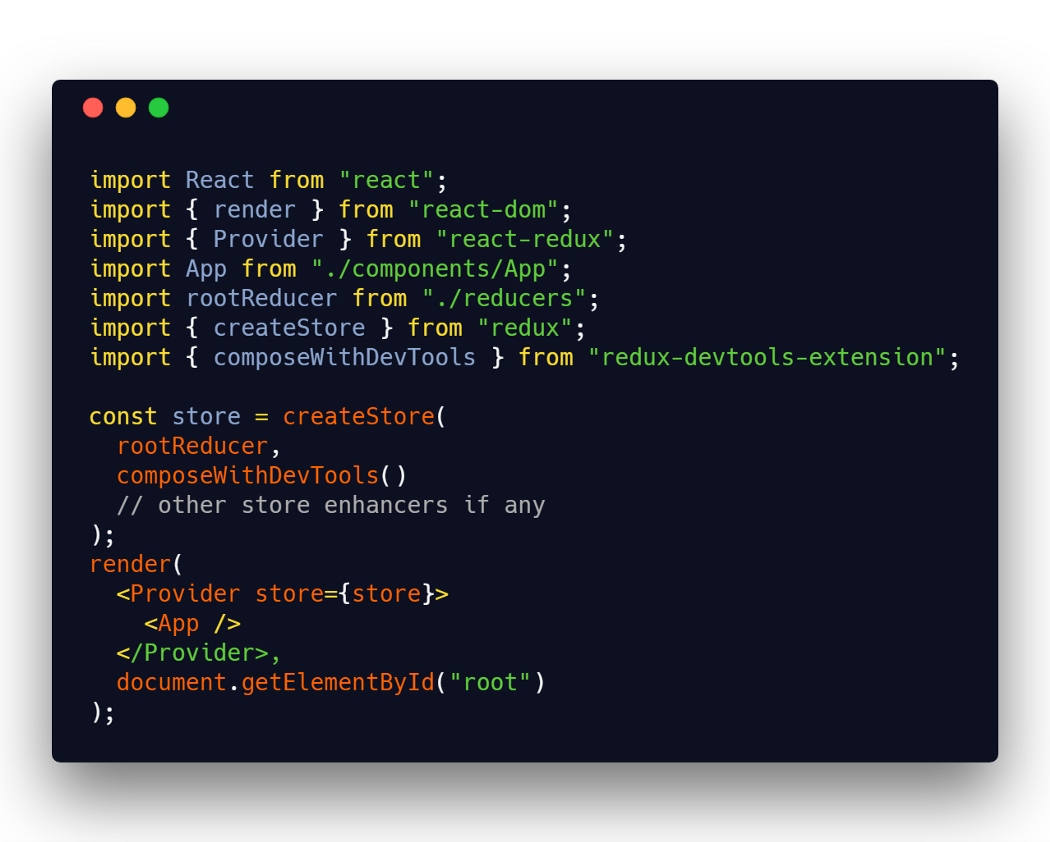
After installing the dependencies we will import the compose functionality from redux dev tools extension using
import { composeWithDevTools } from ‘redux-devtools-extension’;
and we will create our store with Redux DevTools add-on as follows:
const store = createStore(rootReducer, composeWithDevTools( ));
3. Visualizing your states and actions in Redux DevTools Console.
Now navigate to your developer’s console in google chrome by pressing F12 (Windows)
and navigate to the redux extension as shown in the figure below:
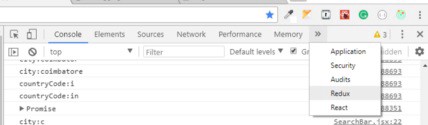
Now, Redux DevTools offers a variety of options to view state, actions and their behavior in your application.
